
Guide
Your monthly report
A narrated recap of what your team did each month.
What it is
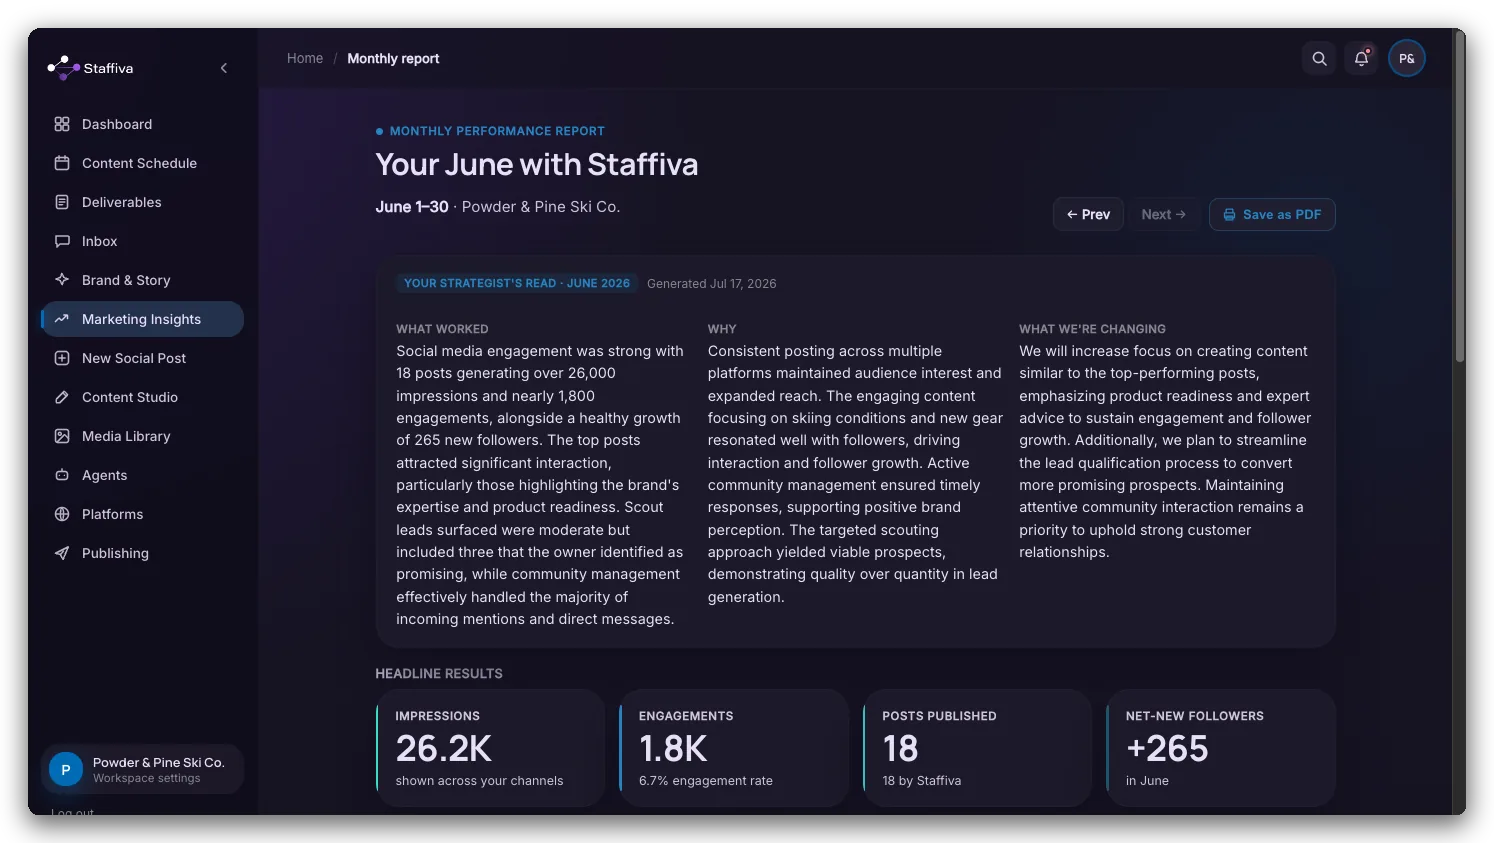
Your monthly report is a narrated recap of what your marketing team did and earned — the kind of summary an agency would send, generated for you. It reads in plain English, not as a wall of numbers.
Where to find it
The report lives on its own page, opened from a card on your Dashboard. There's no separate sidebar entry — the Dashboard card is the way in. Each month has its own report, and the page is print-ready, so you can save or print a copy for your records.
What's inside
- A strategist narrative — what worked this month, why, and what we're changing next.
- Headline KPIs for the month at a glance.
- A per-network table of what went out and how it did.
- Your top posts for the month.
- A content-and-search block covering how your articles and search presence are trending.
The narrative isn't boilerplate — it's the same strategist read that powers Marketing Insights, written for the month: what moved, the likely reason, and the adjustment the agents are making next. It's meant to be read, not just filed.
How it ties into Marketing Insights
The search side of the report draws on Marketing Insights, where Staffiva tracks where you rank, the keywords competitors are winning that you aren't, your backlink profile, and how often ChatGPT and Google AI Overviews mention your site. The monthly report distills that into a short read rather than a dashboard to comb through.
Honest numbers, always
Every performance figure is labeled by how solid it is, so a modeled estimate is never dressed up as a measurement:
- Real — first-party data from Google Search Console.
- Estimated — a modeled figure, clearly marked.
- Awaiting signal — not enough data yet, and no number is invented to fill the gap.
- Not published — nothing live to measure.
Connect Google Search Console (under Marketing Insights) to turn estimates into real, first-party clicks and impressions.
Getting it each month
Open the report any time from your Dashboard, and you can also have it delivered to your inbox each month so the recap comes to you.
How to use it
It's built to be the thing you actually read — or forward. Skim the narrative for the story, check the KPIs for the numbers, and use the “what we're changing” section to see where the agents are steering next. Because it's print-ready, it doubles as a leave-behind for a partner, a boss, or a client who wants to see where the effort went.
What to expect
The report reflects the networks you've connected and the work the agents did that month. Early on, expect more “awaiting signal” labels; they fill in as data accrues and as you connect Search Console.